Recently I have been using Cheat Engine to look at processes’ memory at runtime. This got me thinking if I could do the same without using Cheat Engine. I decided to write a program that could be attached to a running process and which could tell me was running at a given point in time. This sounds an awful lot like what profilers do, doesn’t it?. I narrowed down the target processes to arbitrary python programs run using CPython, as I was somewhat familiar with CPython internals and wanted to avoid the complexity that comes with natively compiled programs.
A bit of background
Python, the language, has many implementations. IronPython, Jython and PyPy to name a few. One such implementation of Python is CPython. It stands out amongst others as it is also the reference implementation that all other implementations follow. The way CPython implements the language can be roughly broken down into two parts.
- Compiler: This takes in the python source code and generates bytecode
for it. If you were wondering what all those
.pycfiles in the__pycache__folder were doing, you’ve got the answer now. The bytecode generated as the result of compilation process are stored in these folders so as to prevent having to do the same job again when the process is run next time. Python also provides the dis module if you want to play around with the bytecode generated for a given piece of python code. - Bytecode interpreter: The bytecode generated in the previous step can’t be run natively by the CPUs that are (normally) present in our computers. They only understand architectures like x86, arm, riscv, mips etc. So, we need a processor that can run the compiled bytecode. As a machine like this doesn’t exist, we need to create one ourselves. And this is what a bytecode interpreter / virtual machine is. It’s “virtual” because it exists as a program and not a physical object. Although, one could try building such a processor in hardware with FPGAs. But I digress.
Python (atleast CPython) uses bytecode instead of interpreting the source code directly or compiling source code all the way down to native instructions as bytecode provides the sweet spot when performance, portability and compilation speed are considered.
For our purposes here, I will be focusing solely on the second part. This is because the code is already compiled to bytecode by the time it starts running and we don’t need to concern ourselves with how we got the bytecode.
Bytecode Interpreter
The bytecode interpreter in CPython, unsurprisingly, is implemented in C. This is where code comes to life. Code gets provided the compute and memory resources so that it could do what it is meant to do.
CPython 3.11 stores all the state information for the interpreter in a struct called _PyRuntime
. This struct can be used to get the currently running thread, which in turn contains the name of the function running. And this is what we are after. So, it is crucial that we get the address of the _PyRuntime struct in the address space of the target python process. So, how do we get to this struct?
But a couple of disclaimers before we continue. Firstly, the _PyRuntime struct is an implementation detail and not part of the stable C API
exposed by CPython for writing native extensions. So, it can change or be replaced with something completely different between python versions. So, we will further restrict our set of target programs to any python program run with CPython version 3.11. Secondly, CPython can be distributed either as a statically linked binary or as a shared library
. We will be focusing solely on statically linked versions for the sake of simplicity. But it is possible to use the same methods described in this post on dynamically linked versions as well.
So, from now on, all references to Python specifically mean statically linked CPython 3.11, unless otherwise specified.
Where’s the start?
The _PyRuntime struct is exposed as an extern symbol
. This means that there is an entry in the symbol table of the object file generated on compilation. In linux land, the object files are in ELF format
. The symbol tables map each symbol to a value that represents its address in the virtual address space of the running process.
Disclaimer: This isn’t the whole truth. But for now, this should give a good enough idea of what we intend to do. The symbols can be present in different sections of the ELF generated depending on how the executable is linked and sometimes even be completely absent. But we will ignore these complexities and just assume that symbol resolution is just as simple as it is described above. You know what they say?! Ignorance is bliss. It has never been more true. But if you want to be a spoilsport and want to know more about it, this , this and this can be good starting points.
So, we can use the value in the symbol table to find the _PyRuntime struct in the running target process. After that, all we have to do is follow pointers till we reach the function name of the running function.
We can use tools like nm or readelf to get the symbols defined in an ELF file.
readelf --syms $(which python3.11) | grep -w _PyRuntime
 Num:       Value        Size    Type    Bind   Vis     Ndx   Name
1165: 0000000000aacaa0 0x28b20 OBJECT  GLOBAL DEFAULT   26   _PyRuntime
Let’s get our hands dirty!
Is anyone else tired of all the theory? I know I am.
It’s time to see things in action! Let’s fire our trusty gdb and get hacking. I will be using gdb to demonstrate the plan to get to the name of the currently running function in our target python process. We will later translate this process to code, which can fetch this information for us.
Debuggers like gdb use DWARF
to map assembly instructions to source code, among other things. DWARF is a file format to store debugging information. It works well along with the ELF format that we mentioned above. So, for this step, we will need a python binary built with debugging symbols. Steps to build python binary with debugging symbols can be found here
.
Note: This provides steps to augment
gdbto provide more information about python structs
Firstly, let’s start a python process. It doesn’t matter what you run as long as it runs for sufficiently long time to attach gdb to the process.
You can attach gdb to the python process using the following command:
gdb PATH_TO_PYTHON_BINARY PID
This launches a new gdb instance and stops the attached python process. We can now run commands to examine the memory of the inferior process (gdb terminology for the attached process). Let’s look at the _PyRuntime struct that we have heard so much about.
(gdb) p _PyRuntime
value of type `_PyRuntimeState' requires 166688 bytes, which is more than max-value-size
Python structs
That was underwhelming! We can try setting the max-value-size to a higher value, but let’s take a different route instead. Let’s take this opportunity to learn more about the _PyRuntimeState (which is the type of our beloved _PyRuntime, if it wasn’t clear already). And then we can examine just the fields that are of use to us.
The infamous GIL
The Global Interpreter Lock , or GIL, is a lock that allows only one thread to hold control of the python runtime at a given instance. As a result, there can be only one thread executing at any point of time. This is one of the reasons multithreading doesn’t scale well in python, especially when the work to be done is CPU-intensive. But, this also simplifies a lot of things, like garbage collection, which would have been a lot more complicated if not for the GIL.
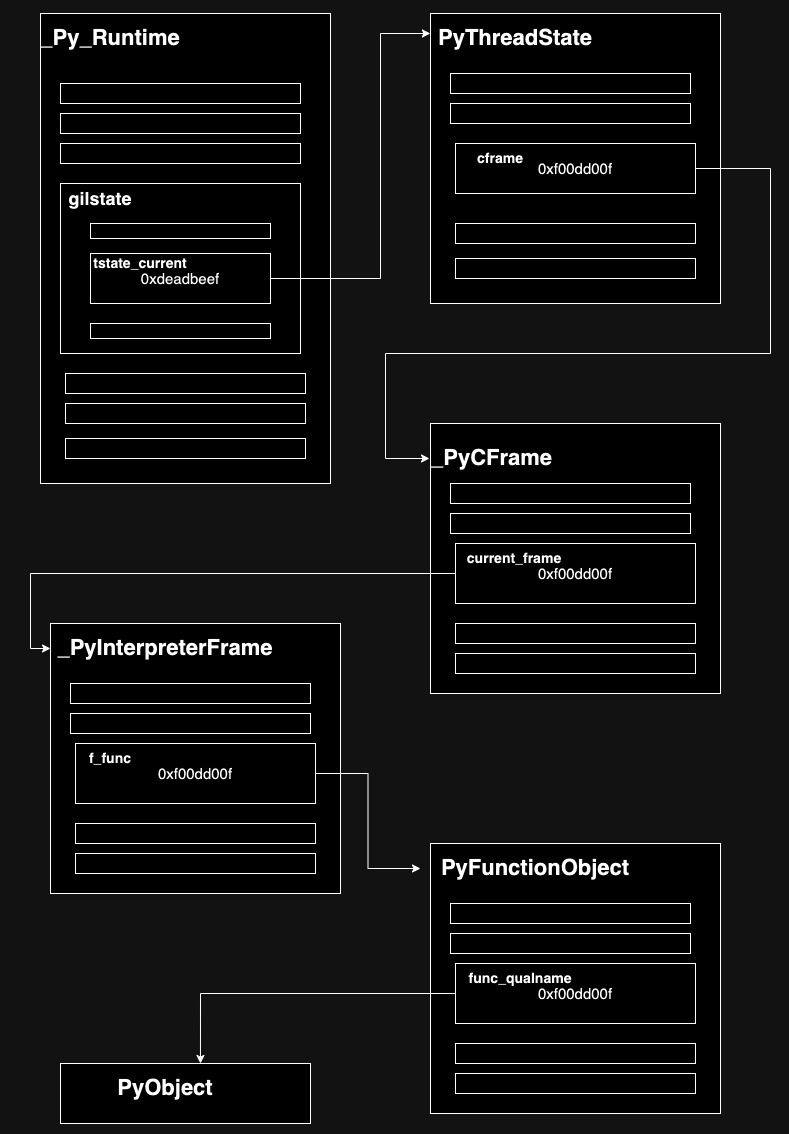
So, in order to find the function currently in progress, we need to find the thread in possession of the GIL. The _PyRuntime struct has a field called gilstate (code
) that holds the address to the PyThreadState struct of the thread in possession of GIL (code
).
(gdb) p (PyThreadState *)_PyRuntime.gilstate.tstate_current._value
$1 = (PyThreadState *) 0x55884581da98 <_PyRuntime+166328>
PyThreadState, _PyInterpreterFrame et al.
Things get much simpler now. We just need to play the game of follow the pointers until we reach our final destination.
PyThreadState contains a pointer to the _PyCFrame which for our purposes is just a wrapper around the _PyInterpreterFrame struct, which represents an individual stack frame in the stack trace (yes, the same thing that you see when something goes wrong!).
(gdb) p $1->cframe->current_frame
$2 = (struct _PyInterpreterFrame *) 0x7f3a19ac2020
The _PyInterpreterFrame contains a pointer to the PyFunctionObject which represents, as you might have guessed, a python function.
(gdb) p $2->f_func
$3 = (PyFunctionObject *) 0x7f3a18f9eba0
Are you bored yet? Okay, let’s do this one last time. The PyFunctionObject contains a field called func_qualname which gives us the name of our function.
(gdb) p $3->func_qualname
$4 = 'treasure'
We have finally found our treasure!
I have tried to summarise this wild pointer chase in this diagram.
Ptrace, my beloved
Remember I said that attaching gdb to a running process stops it? Well, our code will have to do something similar. So, it may be useful to understand how debuggers like gdb do this.
Ptrace!
Yes, that’s the magical word. Debuggers make use of ptrace
to stop the target process. Ptrace can also be used to read the memory of the target process at a given virtual address. We can’t read the memory of another process directly due to separate virtual address spaces
. I will refrain from getting into the details as the post is getting longer than I initially intended.
So, in short, we will use PTRACE_ATTACH to get hold of a running process and to temporarily pause it while we examine its memory. PTRACE_PEEKDATA is used to read the memory of the target process. And finally, when we are done with our detective work, we use PTRACE_DETACH to give the target program its freedom back. Sounds like a plan?
Need for speed
It can be costly to call ptrace everytime we want to read process memory of the target process. Syscalls can be expensive as control needs to be handed over to the kernel and then back to the process. And the target process will be paused while we do our thing.
But there is a way to get the information we need without pausing the target python process. The answer is to use another linux syscall process_vm_readv. process_vm_readv
doesn’t stop the target process while another process tries to read its memory.
Security
Being able to read another process’s memory sounds like a security nightmare. But all the attempts to do so go through the kernel. The kernel makes sure that the process making this request has suitable permissions to do so. If both the processes (process whose memory is read and the process that reads the other process’s memory) must be running as the same user. It also works if the “profiler” is a privileged process with CAP_SYS_PTRACE set.
What’s next?
I have implemented the above features in rust. Code can be found here .
This can be extended to get the whole stack trace instead of just the top of the call stack, as we do currently. The collected information can be exported as a flamegraph .